
Recording beads
Calibration of a microscope setup is crucial for reliable image acquisition, as well as reliable image processing. By analyzing an image acquired from a known object, one can find out how the microscope distorts objects in the image. Knowing the aberrations, these can then be corrected for. The most suitable objects for microscope calibration are spherical beads due to their symmetry in all spatial dimensions.
On this page
Recording beads for PSF distillation
A common application of the method of recording beads is in Point Spread Function (PSF) distillation (a.k.a. PSF extraction or measurement). Each microscope system has its own characteristic PSF, which describes how points from the object are aberrated in the image. This PSF can be determined from 3D images of spherical, sub-resolution beads: being sub-resolution, such beads will act like point objects and thus show as PSFs in the acquired image.
In practice, this is slighly more complicated. Raw bead images can have a low signal-to-noise ratio (SNR) since small beads give only little signal. This typically means that larger beads must be used instead. These beads are no longer point-like, so their image will be a bloated representation of the actual PSF. As such, it is essential to correct for the finite (non-zero) bead size when extracting the PSF; using the raw bead images directly will give an overestimation of the PSF, giving overcorrection when using it for deconvolution.
Even when using larger beads, a single bead image will have Photon Noise. Using the averaging procedure in the PSF Distiller using many beads is therefore recommended.
Choosing beads
Beads will only show as PSFs in the image if their diameter is sufficiently below the resolution of the used microscope. PSF extraction is then complicated by the fact that the number of fluorescent molecules, and thus the signal intensity, scales with the size of the beads: for low-signal microscopy techniques, like confocal or STED, this means that sub-resolution beads may not have sufficient signal to reliably extract PSFs from. Larger beads, however, give a bloated representation of the actual PSF as they are no longer point-like. For all microscopy types, it is therefore important to find an appropriate bead that correctly balances signal and size requirements, based on the microscope's SNR and resolution.
| Suitable beads for different Microscope types | |
| Confocal | 100nm TetraSpeck1 |
| Widefield | 100nm / 200nm TetraSpeck1, 175nm PS-Speck2 |
| Spinning-disk | 100nm TetraSpeck1 |
| Multi-photon | 100nm TetraSpeck1 |
| Re-scan | 100nm TetraSpeck1 |
| STED | GATTA-Beads3, 20nm Nanoparticles4 |
| 3D STED | GATTA-Beads3, 40nm Nanoparticles4 |
| SMLM | 100nm TetraSpeck1 |
2 PS-Speck™ Microscope Point Source Kit Thermo Fisher
3 GATTA-Beads by GATTAquant GmbH
4 Nanoparticles by Abberior Instruments GmbHTetraSpeck — 4-color fluorescent beads
Multi-purpose beads Can be used for chromatic aberration correction Faster bleaching than monochrome beads Less bright than monochrome beads
PS-Speck — monochrome fluorescent beads
High signal No crosstalk Only available with 175nm diameter
Gatta-Beads — origami nanocubes
High signal 23 nm diameter (suitable for STED) Less commonly available
Abberior Nanoparticles-- monochrome fluorescent nanoparticles
High signal 20 or 40 nm diameter (suitable for STED)
Limited amount of fluorophores availableRecommendations and experiences Please note that these points may be outdated as both microscopes and fluorescent beads are constantly being improved.
- If 100nm beads are not bright enough, you may consider using 200 nm beads.
- Do not use averaging to increase the image signal because it will perturb the photon statistics. This is especially a problem with low signal objects like beads. Better use settings involving photon-counting or accumulation.
- Monochrome beads show brighter in the image than their multi-colored counterparts. Note that green tends to bleach fast.
- The wavelengths of the bead fluorophores should match closely with those of the sample, because the PSF structure depends on the wavelength.
- It is not advised to perform a multi-color bead scan (even multitrack) for PSF reconstruction. When using multi-color beads, also for measuring chromatic aberration, beware of the possibility of crosstalk).
- Origami nanocubes (for example these GATTA-Beads) are very well suited for STED PSF distillation. These sub-resolution objects (<40 nm for STED) can be packed with many dye molecules, making them sufficiently bright even under STED imaging conditions.
PSF distillation in Huygens
The Huygens PSF Distiller allows for easy and reliable PSF distillation, with specialized modes for different types of microscopy. The user can load single- or multi-channel images of one or multiple beads. The Distiller automatically discards any unusable beads and averages over the remaining beads. To correct for the finite (non-zero) bead size, the PSF is then computed through an inverse deconvolution run: the algorithm finds the PSF that, when convolved with a model of the known bead shape, produces the acquired bead image. This inverse deconvolution also removes any photon noise remaining after the previous averaging. After distillation, the Distiller automatically estimates the full width at half maximum (FWHM) to allow for easy assessment of the microscope quality.
The PSF Distiller also reports any chromatic aberration, which can subsequently be corrected for in the Huygens Chromatic Aberration Corrector.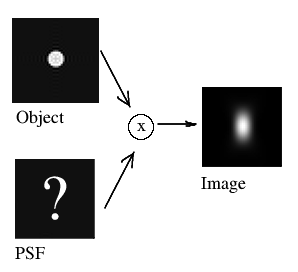
Imaged volume
If the number of planes recorded along Z is too low, you will get an error when distilling the PSF stating that "the axial image size is too small". It can also happen that this error is not displayed but no usable bead is found in your image.
What matters for a correct PSF distillation is not (only) the number of slices, but the total physical volume that is actually imaged. A good bead image includes signal from a large region around the beads, since the resulting PSF will have a cone of blur around its central peak. This blur is especially large in widefield and low Numerical Aperture (NA) images. For example, when using a 0.95 NA objective in a widefield microscope the PSF is very large along Z, so to register all the relevant information a larger volume must be imaged in this direction than if the NA was. You could acquire more planes, but you can also reduce the Sampling Density along Z as long as you still fulfill the Nyquist sampling criterion. The ideal sampling rate (which depends on the NA) for normal imaging can be found using the Nyquist Calculator, but when recording beads some oversampling is recommended.
If you ask the calculator to show also a PSF, you can find out how large it is expected to be, both in real volume and in number of samples when imaged at the Nyquist Rate. Note, however, that you can (or even should) record fewer planes along Z than are shown there, because low-intensity regions at the edge of the PSF are too strongly affected by noise to be captured reliably.
Example: For a 1.3 NA typical widefield microscope, the beads should be recorded in a 3D image that covers at least ~ 12 µm along Z. 50-100 sections at 200 nm will satisfy the Nyquist criterion. If the NA is 0.95, the image should be larger in Z, covering at least ~ 21 µm. The ideal sampling rate along Z, however, is larger as well: approximately 700 nm. If you record the beads with some oversampling, with one plane at every 500 nm, you then need 42 planes to cover the required volume. Therefore, the required volume for NA = 0.95 can be covered without recording more planes than for NA=1.3.
Bead density
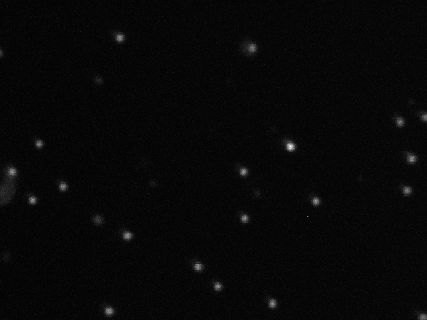
If the bead density in the image is much larger than 10 beads per 20µm x 20µm region, chances are that they are too close to each other. Their blurred images then overlap and it is no longer possible to disentangle their PSFs. The PSF Distiller will reject beads that are too close to each other. You can make its criterion less strict by using the "reduce PSF size" parameter, but there is a limit for this to work properly.
Procedure outline
Before mounting the beads, consider putting the mounting surface in the plasma cleaner. This surface is then made hydrophilic, causing the beads to spread.
Note that if the bead density is much larger than 10 beads per 20µm x 20µm region, the beads are often too close to each other: their blurred images then overlap and it is no longer possible to disentangle their PSFs. The Huygens PSF Distiller will reject beads that are too close to each other.
Also note that, as the beads should be measured under the same conditions as you will use later for your samples, the same mounting medium should be used as well.You can decrease noise and thereby improve your bead image quality by recording multiple images of different beads. This is recommended for confocal images due to their low SNR. When doing this, watch out for clipping by checking (before PSF distillation) that none of the images contain suspiciously large amounts of pixels/voxels with a 0 or with a 255 intensity value. For high SNR images, for example from a widefield microscope, one bead image may be sufficient to distill a PSF from. Remember, however, that this image can never be used as a PSF directly: it first needs to be centered, the background must be removed, and it must be corrected for noise and finite beads size.
Recording beads for chromatic aberration correction
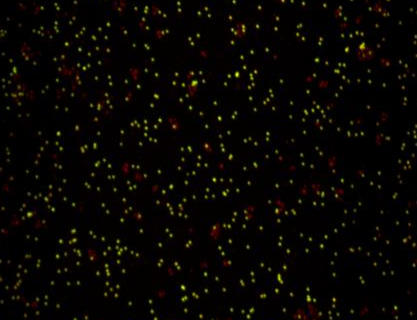
Multi-channel imaging systems often suffer from chromatic aberrations, which show in the image as shifts, rotations, and scaling differences between channels. To measure these aberrations, and subsequently correct for them, it is necessary to record images of known multi-colored objects. Multi-colored beads are well fit for this purpose: all colors fully overlap in the true object (the beads) so any misalignment seen in the image is an imaging artefact. Bead images can thus be used to measure the aberration parameters of the used microscopy system, for example the shift between the red and the green channel in the x-direction. These parameters can then be used to correct for the aberrations in images taken under similar conditions.
It is advised to perform deconvolution prior to chromatic aberration correction for more precise correction (based on the finer image details revealed by deconvolution).
Chromatic aberration correction in Huygens
All types of chromatic aberration can be corrected with the Huygens Chromatic Aberration Corrector. After receiving an input image, the Corrected can automatically estimate shifts, rotations, and scaling differences between channels. A graphic user interface shows overlays of the estimated values on different views of the original image and allows the user to adjust the initial estimation. The Corrector can then correct the image immediately or it can be used to save a template of the estimated aberration parameters. The latter is typically done after estimating the parameters from bead images. This template can then be loaded for any image taken under similar conditions and used to perform calibrated chromatic aberration correction there.