
Huygens Remote Manager - SNR estimator
Since version 1.2 of HRM, together with version 3.5.1 of Huygens Core, a Signal To Noise Ratio estimator is available that will return suggested Signal-to-Noise ratio (SNR or S/N) values, based on a representative image, to fill out the Restoration Task Settings form.
Using the estimator in HRM
The SNR estimator in HRM will return reasonable starting values for the type of images you want to deconvolve. You can further tune this SNR value by comparing the corresponding deconvolution results, to adapt the restoration to the experimental needs.
The estimator works by letting you select a raw image, among the ones present at your directory in the HRM server, and automatically inspecting the level of noise in its different channels. A best-guess will be returned per channel, that you can write down and enter in the restoration task settings. (Values will not be entered automatically in the form).
It is important to select an image for the estimation that is representative of the kind of images you want to deconvolve later, if you plan to run multiple jobs with the same settings.
Please notice that each channel may have a different noise level.
Graphical output
Together with the best estimate, the HRM will return a collection of images (small portions of the whole dataset), simulations of how the raw data would have looked had the SNR been different during the acquisition. These images can be compared with the original data to visually confirm the correctness of the estimate.
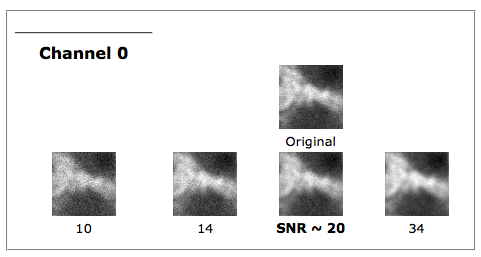
By hovering your mouse pointer over the images, you get a zoomed image with which you can better see the granularity of the image, caused by the different noise levels. The texture of the image with the best SNR value should be the most similar to the original dataset:


Notice that these are just simulations of how the raw data would have looked with different noise levels, they are not deconvolution results. To see how the different SNR parameters affect the quality of the result, you have to use them in deconvolving the dataset.
(Tip: move your mouse from left to right over the simulations for one channel to make the zoomed image change rapidly: you'll see it as an animation of varying noise!!!)
Difficulties during the estimation
Please notice that Under Sampled images will provide wrong SNR estimations. Undersampling will make deconvolution fail anyway, so in this case it is not so important that the SNR is not so correctly estimated. It is highly advised to acquire your images as close to the Ideal Sampling as possible.
The estimator will try to avoid regions of the image where clipping occurs, as this can also generate bad SNR estimations. But if the image is severely clipped in its more interesting regions, the tool may not provide a meaningful result. Again, this is less important than the fact that deconvolution will fail with Clipped Images.
Effects of the SNR parameter
The SNR is used in the Huygens Software as a Regularization Parameter, i.e. as a parameter that controls the sharpness of the restoration result. The higher this value, the sharper your restored image will be.
Therefore you should not think of the SNR as a parameter describing your original image, but as a tunable parameter that controls the deconvolved result, like the 'number of iterations' does.
One can only afford using very high SNR values, that will produce sharper results, when the raw data is noise free and smooth. Using a too large SNR value might be risky when restoring noisy originals, because you could be just enhancing the noise.
A noise-free widefield image usually has SNR values higher than 50. A noisy confocal image can have values lower than 20.
For more details about this parameter, see SNR.