
Image histograms
An image histogram is a graphical representation of the number of pixels in an image as a function of their intensity.
Histograms are made up of bins, each bin representing a certain intensity value range. The histogram is computed by examining all pixels in the image and assigning each to a bin depending on the pixel intensity. The final value of a bin is the number of pixels assigned to it. The number of bins in which the whole intensity range is divided is usually in the order of the square root of the number of pixels.
Image histograms are an important tool for inspecting images. They allow you to spot BackGround and grey value range at a glance. Also clipping and Quantization Noise in image values can be spotted immediately.
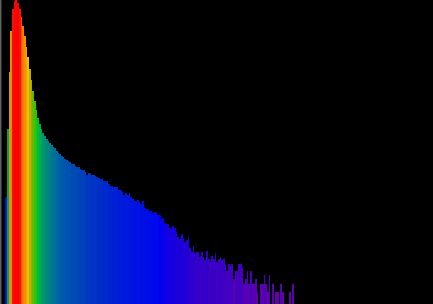
In the one-dimensional histogram shown here below (as in the other linked examples), the number of pixels in each bin is represented both by the height of a bar, and by a color scale coloring each bar. Higher bars have colors closer to red.
By extending this histogram concept to multiple dimensions we can also make representations of Two Channel Histograms, or more.
Histogram in the Essential's wizard
Image histogram is computed and displayed in Huygens Essential during the deconvolution process. The histogram stage is included for examining purpose only, to let you spot problems that might have occurred during the image recording. It has no meaning for the deconvolution process that follows.
See Review Image Histogram in the Essential Deconvolution Roadmap for relevant interpretation tips.
Computing the image histogram
In Huygens Professional it can be computed with any of the following:
- Select the image by clicking on its thumbnail image in the Huygens Main window. Select the option Image histogram from the Edit menu (or type
Alt+G). The histogram will be computed using default values. - Open the Operation window of the selected image by clicking on the small button labeled O on the right side of the images' thumbnail. You will find the Compute histogram choice in Analysis. It gives you the opportunity to select the percentile and representation mode.
- A Tcl-command typed directly in the Tcl shell Tab in the Main window.:
yourImageName hist
for the default. Or you may type for example:
yourImageName hist -vAxis lin -perc 25 -tclReturn
In this example the vertical axis is in linear mode (log or sigmoid is also possible), the percentile is 25%. The tclReturn option is useful when running a Tcl script in batch processing and the numerical histogram values are needed for further evaluation.
The percentile indicates the value below which a given percentage of the values occurs. The percentile corresponds to a value with a specified cumulative frequency. Some percentiles have special meaning: The 50 percentile value indicates that half of the observations are less this value (and half is greater), being just another name for median. Other special percentiles are the 5-th and the 95-th percentiles, both specifying the 90% central range, the range within which the central 90% of all values lie.
Displaying the histogram
The histogram results are displayed as a thumbnail in the Huygens Professional Main window. The thumbnail gives you a rough impression of the results. Opening the thumbnail in the Expand viewer gives you access through numerical analysis on a pixel-basis.
To obtain the histogram data in a text string, use the
-exportData option in the histogram command (when typed in a Tcl shell in the Pro or the Scripting).See some examples of image histograms and their applications in the following articles: